CGM+ App - Settings
Configure the CGM+ App to customize how your glucose data is displayed and shared. All settings can be adjusted through the Garmin Connect app.
Where to find settings: Open Garmin Connect → My Devices → [Your Device] → Watch Apps → CGM+ GB → Settings
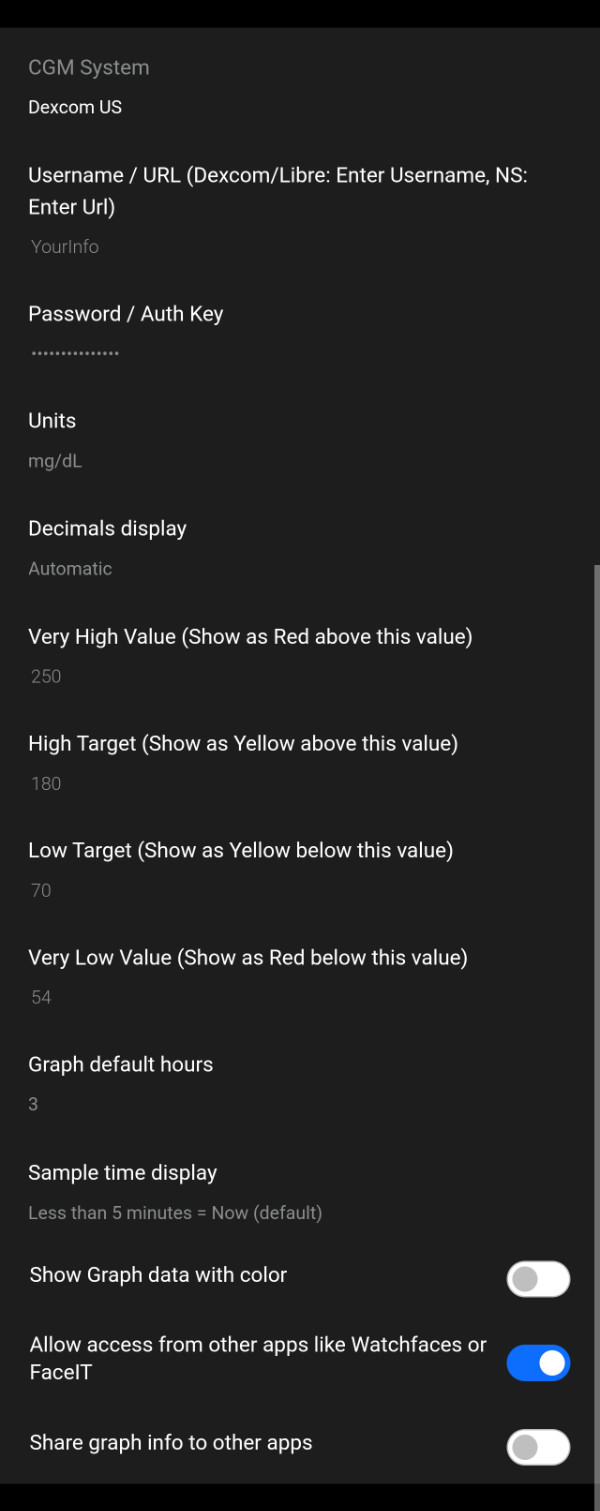
Settings
CGM System
Select the CGM system you are using:
- • Dexcom US: United States Dexcom accounts
- • Dexcom Outside US: International Dexcom accounts except Japan
- • Dexcom Japan: Japanese Dexcom accounts
- • FreeStyle Libre / LibreLinkUp: Use Libre / Abbott
- • Nightscout: Use Nightscout
- • xDrip+: Use xDrip+
- • Juggluco: Use Juggluco
- • AAPS: Use AAPS
- • Nightscout Direct: Nightscout direct call, will have limited results due to memory restrictions
- • Test Mode: Provides simulated test data only (for testing/demonstration purposes)
Important: Selecting the wrong region will cause authentication failures. Choose the region where your Dexcom account was created.
Username / URL
For Dexcom: Your Dexcom username. This is the same account you use to log into the Dexcom website. NightScout: Enter your Nightscout URL here.
Password
Your Dexcom Share password. This is stored on your Garmin device.
Security: Your credentials are only stored locally on your watch and are only used to authenticate with Dexcom/Nightscout servers.
Display Settings
Units
Choose how glucose values are displayed:
- • mg/dL: Milligrams per deciliter (common in US) - e.g., 120 mg/dL
- • mmol/L: Millimoles per liter (common internationally) - e.g., 6.7 mmol/L
Conversion: 1 mmol/L ≈ 18 mg/dL
Decimals Display
Control how many decimal places are shown in glucose readings:
- • Automatic: Shows 1 decimal for mmol/L, none for mg/dL when value is above 100
- • No Decimals: Always shows whole numbers only - e.g., 120 or 7
- • 1 decimal: Shows one decimal place - e.g., 120.5 or 6.7
- • 2 decimals: Shows two decimal places - e.g., 120.50 or 6.72
Sample Time Display
Choose how the last sample time is displayed:
- • Less than 5 minutes = Now (default): Shows "Now" for readings less than 5 minutes old, otherwise shows minutes ago
- • Less than 1 minute = Now: Shows "Now" only for very recent readings (under 1 minute)
- • Show seconds since last sample: Always shows time elapsed in seconds/minutes. Note that this will only refresh when you refresh the app, or change the graph time
Examples: "Now", "3m ago", "45s ago"
Note: Sample time is when Dexcom took the last reading
Stale Data Warning (minutes)
Marks data as stale when older than the specified number of minutes. On watchfaces, a minus (-) prefix is added to the glucose value to indicate the data may not be current.
Example: A reading of 120 displayed as "-120" on your watchface indicates stale data
Stale Data Cutoff (minutes)
Marks data as expired when older than the specified number of minutes. The value will show as -1 on watchfaces and will be striked out in the CGM+ App itself, indicating the data is too old to be useful.
Example: When data exceeds this threshold, watchfaces display "-1" and the app shows 120
Glucose Range Settings
Configure your target glucose ranges. Values outside these ranges will be displayed in different colors to help you quickly identify high or low readings.
Very High Value (Red)
Glucose readings above this value will be shown in red, indicating a critical high level.
Example values: 250 or 13.9
High Target (Yellow)
Glucose readings above this value (but below Very High) will be shown in yellow/orange.
Example values: 180 or 10.0
Low Target (Yellow)
Glucose readings below this value (but above Very Low) will be shown in yellow/orange.
Example values: 70 or 3.9
Very Low Value (Red)
Glucose readings below this value will be shown in red, indicating a critical low level.
Example values: 55 or 3.1
Auto-conversion: When switching from mg/dL to mmol/L units, the app automatically converts these glucose threshold values if they appear to be in the old unit (values below 38 are assumed to be mmol/L and are multiplied by 18). However, you should always verify your thresholds are correct after changing units.
💡 Color Coding Summary:
- 🔴 Red: Below Very Low OR Above Very High (urgent attention needed)
- 🟡 Yellow: Below Low Target OR Above High Target (caution)
- 🟢⚪ Green or White: Within target range (Low Target to High Target)
Graph Settings
Show Graph Data with Color
When enabled, graph data points are color-coded based on your glucose range settings:
- • On: Graph uses colors (red, yellow, green) to show glucose levels - easier to spot patterns
- • Off: Graph displays in a single color - cleaner appearance, uses less power
Data Sharing Settings
These settings allow the CGM+ App to share data with other apps on your Garmin device, such as watchfaces or the FaceIT customization app.
Allow Access from Other Apps
Enables other apps like watchfaces to read your current glucose data.
- • On: Watchfaces can display your glucose value, trend arrow, and reading time
- • Off: Data is only visible within the CGM+ App itself
Required for watchface integration: Turn this ON if you want to see glucose data on your watchface via datafields.
Share Graph Info to Other Apps
Enables sharing of historical glucose data for graph display in other apps. "Allow Access from Other Apps" needs to be enabled as well for this to take effect.
- • On: Other apps can access graph data points for creating their own visualizations
- • Off: Only the current reading is shared (if first setting is enabled)
Performance note: Sharing graph data may slightly increase battery usage as more data is synchronized.
💡 Tip: After changing settings, it may take a few minutes for them to sync to your watch. You can force a sync by opening the Garmin Connect app or checking for updates on your device.
⚠️ Important Disclaimer
- NOT FOR MEDICAL DECISIONS: This app is for informational purposes only and should NOT be used to make medical decisions.
- Always verify readings: Confirm glucose values with your official Dexcom receiver or app before taking action.
- Emergency situations: In case of extreme glucose levels or medical emergencies, use your primary CGM device.
- Delayed data: Readings may be delayed by several minutes due to how often the app can sync.
- No liability: The developer assumes no responsibility for health outcomes related to the use of this app.
- Not affiliated: This app is not approved by, endorsed by, or affiliated with Dexcom, Abbott (Libre), or any other medical device company.