Dexcom - App Controls and Data
Below you can find how to control the app and what data is displayed.
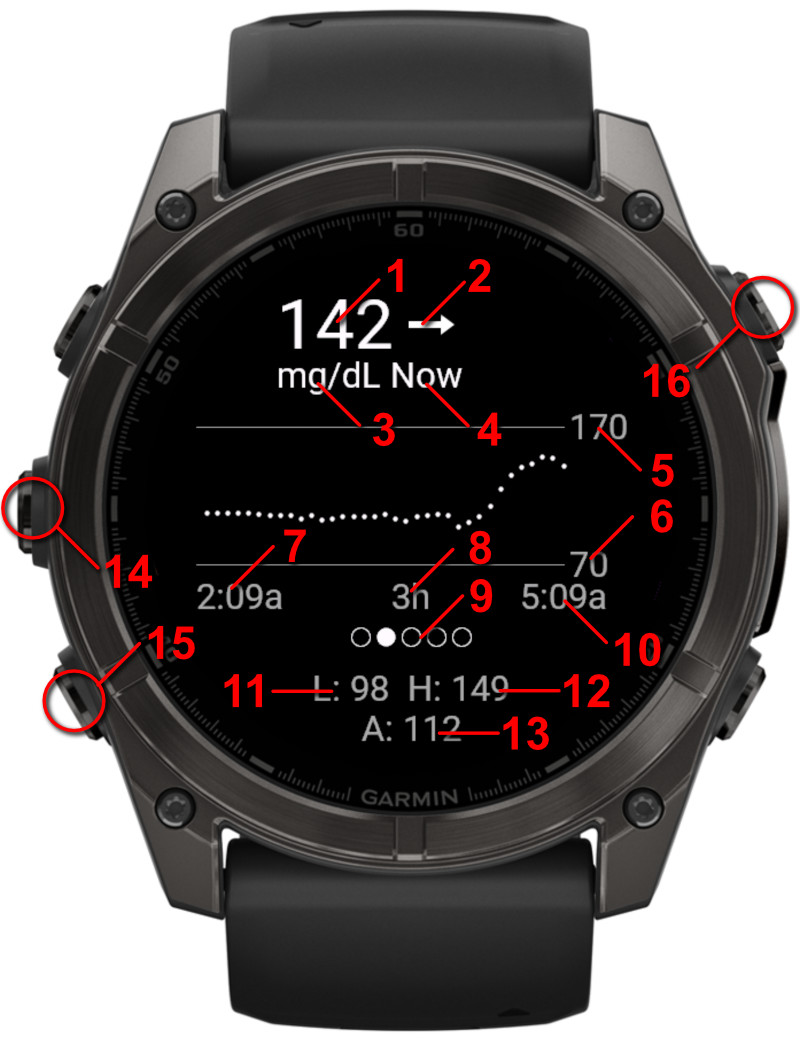
1.
Current sample reading
2.
Trend icon
3.
Units as set in the settings
4.
Last sample time
5.
Upper Target
6.
Lower Target
7.
Time of first sample on the chart
8.
Time period indicator - Shows how many hours are displayed in the chart
9.
Current chart indicator - Visualization to show which chart is active
10.
Time of last sample on the chart
11.
Lowest reading in this time period
12.
Highest reading in this time period
13.
Average reading in this time period
14.
Go to previous chart (swipe left)
15.
Go to next chart (swipe right)
16.
Refresh data - Refreshes the data if the last reading was more than 5 minutes ago
Glance View
The Glance view provides a quick overview of your current glucose reading without opening the full app.
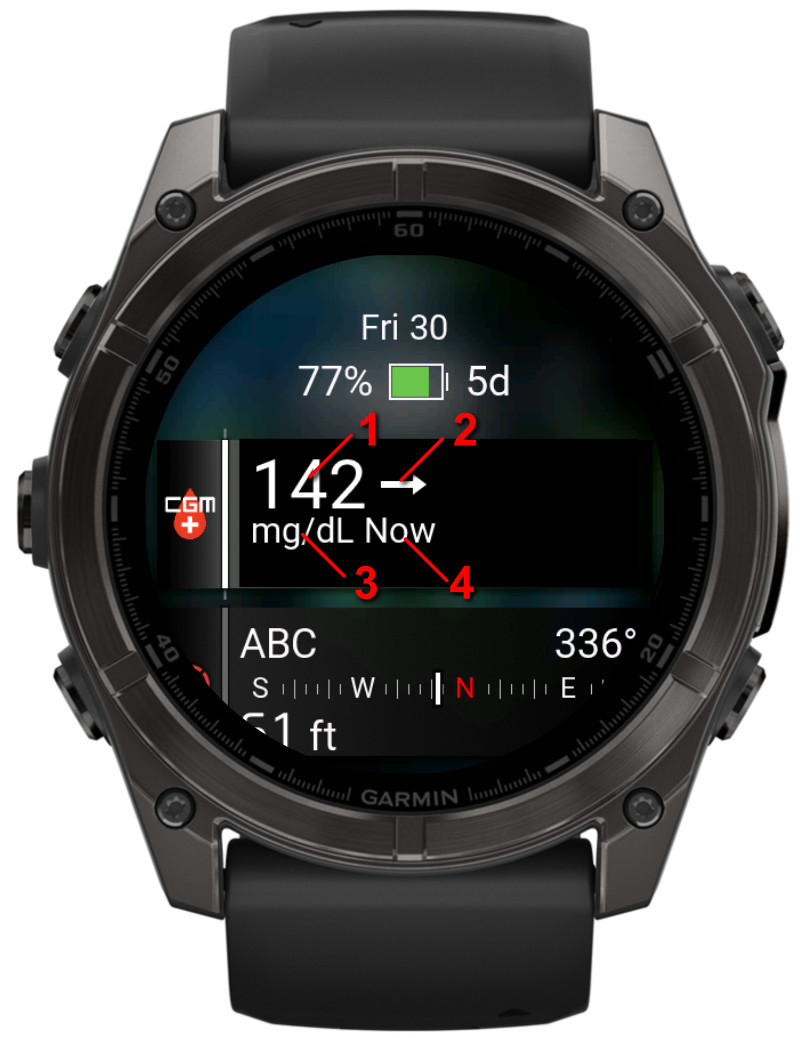
1.
Current sample reading
2.
Trend icon
3.
Units as set in the settings
4.
Last sample time
Watchface View
Display on a watchface. This example shows the data in the Left circle field on the Fenix 8 V3 watchface
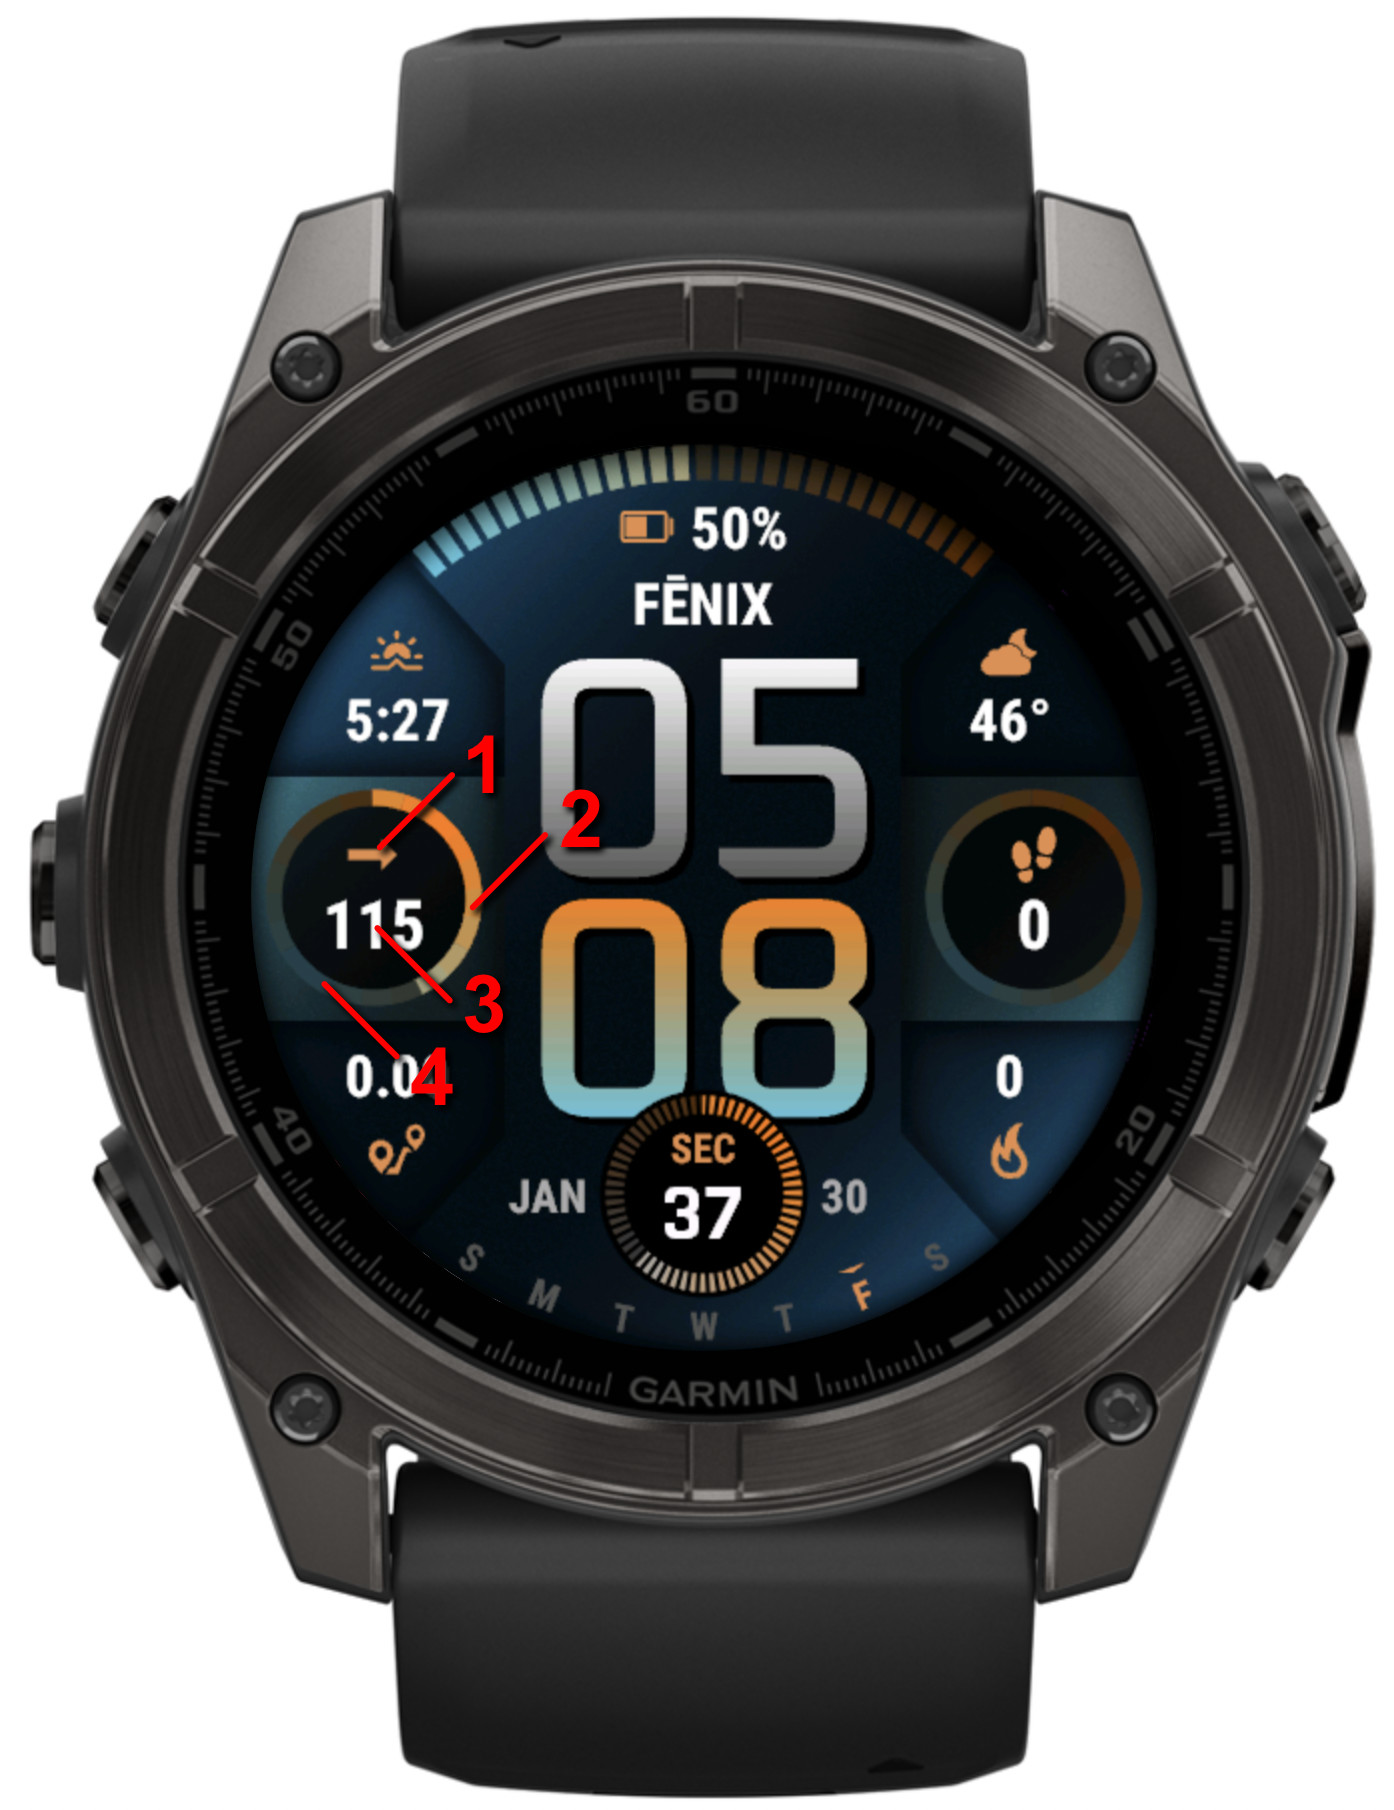
1.
Trend icon
2.
Progress in between the upper and lower target (in this example, targets are set as 70 low and 170 high)
3.
Current sample reading
2.
Progress in between the upper and lower target, unfilled part
⚠️ Important Disclaimer
- NOT FOR MEDICAL DECISIONS: This app is for informational purposes only and should NOT be used to make medical decisions.
- Always verify readings: Confirm glucose values with your official Dexcom receiver or app before taking action.
- Emergency situations: In case of extreme glucose levels or medical emergencies, use your primary CGM device.
- Delayed data: Readings may be delayed by several minutes due to how often the app can sync.
- No liability: The developer assumes no responsibility for health outcomes related to the use of this app.
- Not affiliated: This app is not approved by, endorsed by, or affiliated with Dexcom, Abbott (Libre), or any other medical device company.